
Investing · Market Structure · 11 min read
Nifty Has Been Flat for 2 Years. The Rest of the Market Hasn't.
By Inderpreet Singh, QPFP · NISM Certified Investment Advisor L1 · September 2026 · 11 min read
Last updated: September 8, 2026
On September 26, 2024, Nifty 50 touched an intraday high of 26,277.35. It didn't meaningfully exceed that level again until January 2, 2026, when it reached 26,329, a "new high" that was just 0.2% above the old one. Since then, it has fallen further. For practical purposes, India's most-watched stock market index has gone nowhere in two years.
In that same window, Nifty Midcap 100 and Nifty Smallcap 100 both broke out to genuine, decisive record highs. Not a rounding-error new peak, real ones, well clear of anything they'd touched before.
If you've been reading headlines about a struggling Indian market, that's the Nifty 50 story. It is not the story of the other roughly 490 companies in the Nifty 500.
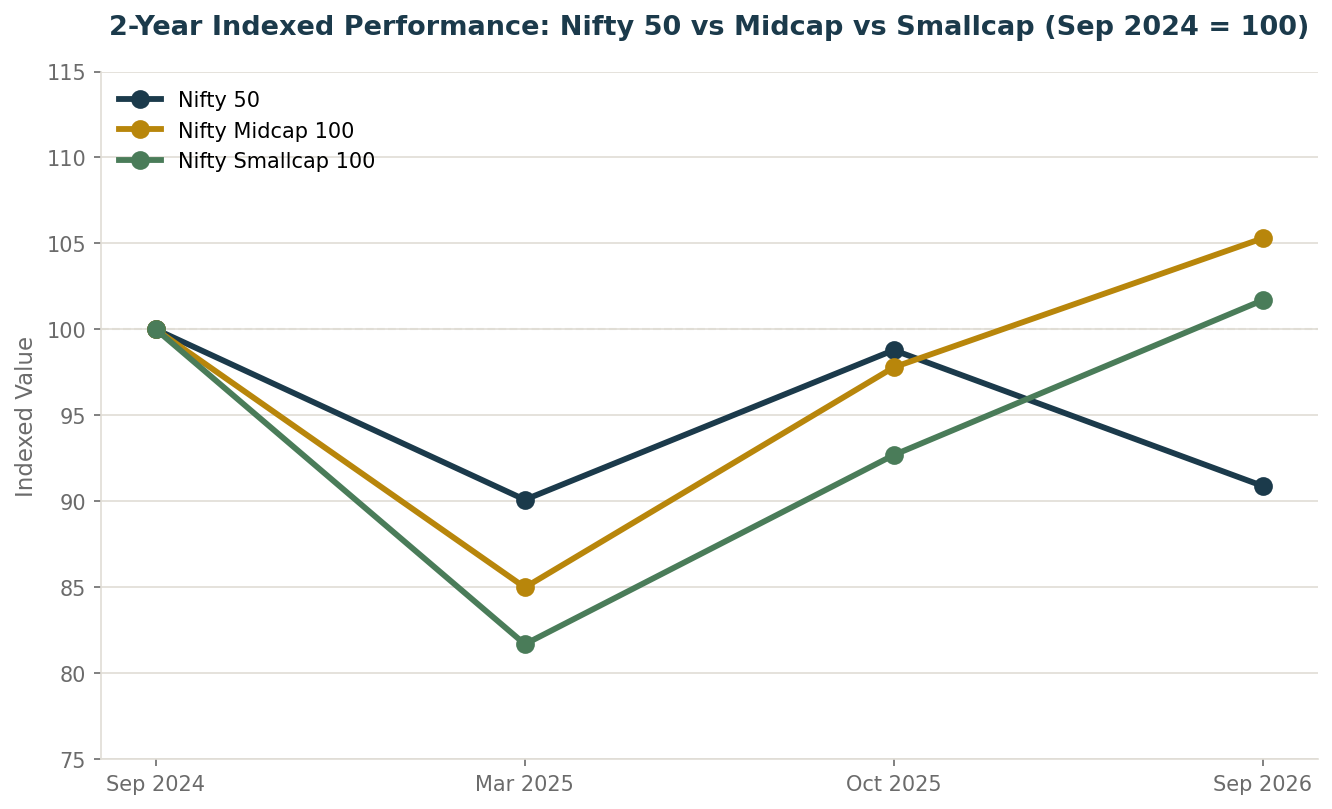
Indexed to 100 at September 2024. Built from four sourced checkpoints (Sep 2024, Mar 2025, Oct 2025, Sep 2026), not a continuous daily series, the actual path between points included additional moves not shown here.
The one-line version
A handful of very large, currently struggling stocks are heavy enough to hold the entire Nifty 50 flat, even while the broader market underneath it has genuinely thrived. The headline index and the health of Indian equities are not the same thing right now.
Why a Handful of Stocks Can Hold the Whole Index Back
Nifty 50 is weighted by free-float market capitalisation, larger companies move the index more than smaller ones. That's a reasonable design in general, but it has a specific consequence right now: the top 10 constituents of Nifty 50 account for roughly 53% of its total weight. One-fifth of the companies in the index determine more than half of its movement.
When most of the index is fine but a few giants inside that top 10 are struggling badly, the headline number reads as weak even though it's describing a small, specific problem, not a broad one.
Why Is Nifty Falling? What's Actually Doing the Dragging
Four names carry an outsized share of the blame, and each has its own distinct story, not one shared narrative.
TCS
-37% from 52-week high
Rs 3,630.50 to Rs 2,283, on AI disruption fears and slower US/Europe tech spending
Infosys
-35% from 52-week high
Rs 1,728 to Rs 1,123, same sector-wide pressure as TCS
HDFC Bank
-31% from 52-week high
Rs 1,020.35 to Rs 703.55, on CEO succession uncertainty, governance concerns, and NIM pressure
Reliance Industries
-19% from 52-week high
Rs 1,611.80 to Rs 1,309
The IT majors are facing a genuine structural question, whether AI-driven automation reduces demand for traditional outsourced services, layered on top of cautious technology spending from US and European clients. HDFC Bank's decline is a more company-specific story: leadership uncertainty following its CEO's decision not to seek another term, governance concerns, and margin pressure from post-merger balance sheet normalisation. Reliance's pullback is milder and reflects a mix of sector and company-specific factors rather than a single dominant cause.
These are four separate problems that happen to sit inside the same 10 stocks that determine most of Nifty's movement. That's the mechanical reason a genuinely broad market can still produce a flat headline index.
Nifty Midcap 100 and Smallcap 100 at Record Highs, While Nifty 50 Falls or Stays Stuck
Year-to-date in 2026, Nifty 50 has declined roughly 7.8%. Over the same period, Nifty Midcap 100 has gained around 5.1% and Nifty Smallcap 100 has surged approximately 12.5%, according to Business Standard's analysis of the calendar year through early September. Both broader indices are sitting at genuine record highs, not near them, at them.
This divergence is worth sitting with. It's not one or two strong months, it's a sustained, multi-quarter pattern where thriving companies across the mid and small-cap universe are quietly compounding while the headline index tells a story about four large, currently-struggling names.
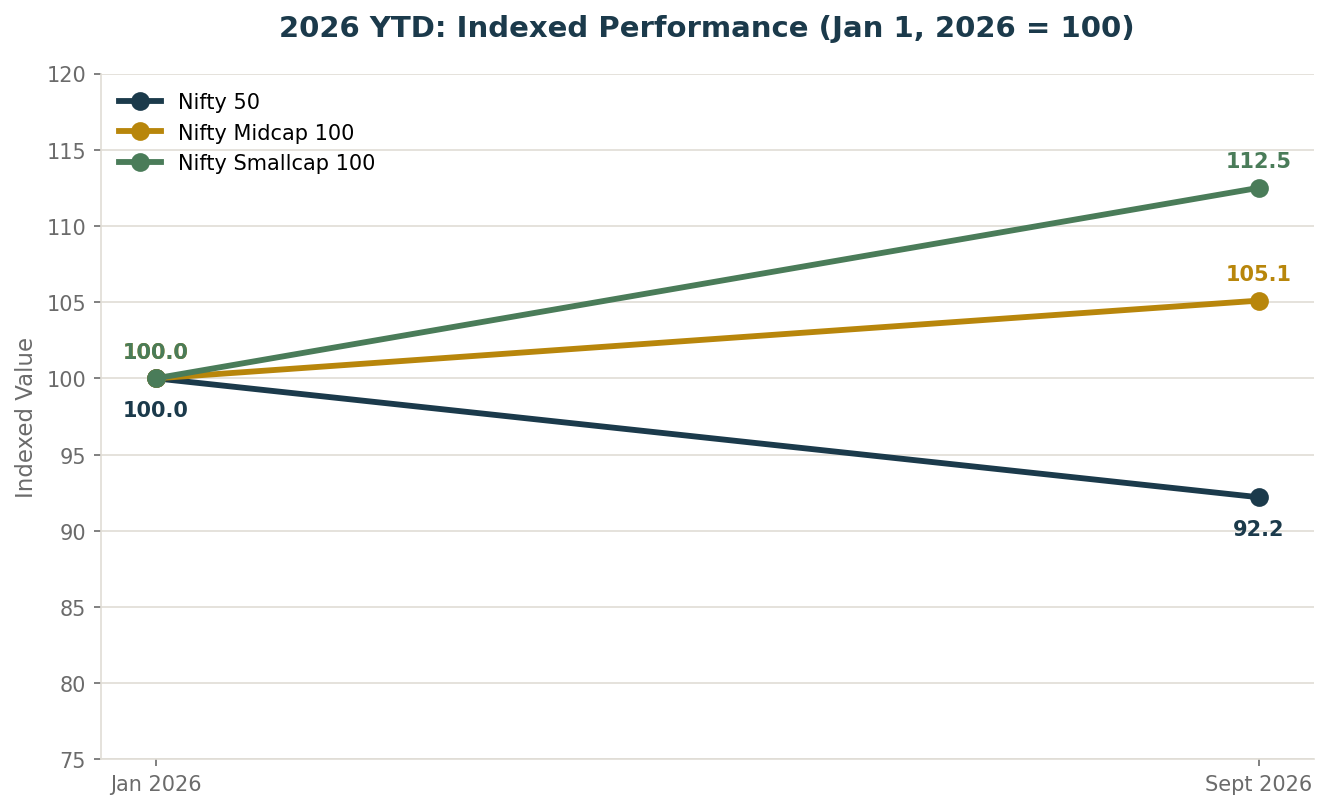
Indexed to 100 at January 1, 2026, based on confirmed year-to-date returns as of early September 2026.
Where Nifty Next 50 Sits in This Picture
Nifty Next 50, the index tracking India's 51st to 100th largest companies by market cap, tells a third version of this story. As of early September 2026, it trades around Rs 72,301.80, down just 3.6% from its 52-week high of Rs 75,000.40, a high that itself exceeded its prior all-time closing peak of Rs 74,059.40 set in July 2024. Unlike Nifty 50, Next 50 did break through to a genuine fresh record within the past year before pulling back modestly. Over longer horizons the gap is even more visible: Next 50 has returned roughly 8% over one year, 60% over three years, and 71% over five years, compared to Nifty 50's -2.9%, 22%, and 39% over the same periods respectively.
Next 50 isn't at a fresh record the way Midcap and Smallcap are right now, but it's clearly closer to full health than Nifty 50, another reminder that "the market," described as a single number, can mean genuinely different things depending on which slice of it you're looking at.
This Happened Despite Real Headwinds, Not the Absence of Them
This isn't a story of calm markets and easy conditions producing broad gains. The backdrop for this entire period includes genuinely serious, recurring pressures: repeated Iran-linked oil shocks pushing crude toward $96 a barrel, a global bond yield environment that's stayed elevated and occasionally spiked further, and real fears about AI disrupting entire service industries. We've tracked all of these directly in recent weeks.
That the broader market kept compounding through all of it says something specific: the earnings and demand story underneath most of India's listed companies has stayed genuinely resilient, even while a handful of index heavyweights dealt with problems that were largely their own. That's a meaningfully more reassuring picture than "the market is struggling," even if it isn't the picture the headline number shows.
So Which Benchmark Should You Actually Watch?
There isn't a single right answer, it depends entirely on what you actually hold, and this is where the practical takeaway lives.
If your portfolio is genuinely large-cap heavy, Nifty 50 remains a fair, relevant benchmark, its flatness reflects real weakness in the specific stocks you're likely holding.
If you hold midcap, smallcap, or flexicap funds, judging them against Nifty 50 right now is comparing apples to a different fruit entirely. A midcap fund that's up double digits this year looks unremarkable next to a "the market is flat" headline, when it's actually tracking its own benchmark closely and doing exactly what it's supposed to.
The simplest fix: check what benchmark your specific fund actually reports against in its factsheet, and compare performance to that, not to whichever index happens to be in the day's headline.
This concentration risk is exactly why fund selection and category matter more than chasing whichever index looks strongest this month. See the category-by-category fund guide, or check why your equity-debt mix matters more than fund selection.
The Real Takeaway Isn't Caution, It's Opportunity
Everything walked through above already happened, to real portfolios, this year. Smallcap 100 up roughly 12.5%. Midcap 100 up around 5.1%. Nifty Next 50 comfortably ahead of Nifty 50 across every recent time horizon. These are not projections or hopes, they are results that were available to investors who were positioned for them.
The gap that actually matters isn't between "a good market" and "a bad market." It's between investors who were allocated toward where the genuine growth was happening, and investors who read "Nifty is flat" and quietly concluded nothing was working. Both groups looked at the same Indian stock market this year. Only one of them captured what it actually delivered.
Knowing which benchmark to watch, and building an allocation that's genuinely positioned rather than accidentally concentrated in a few large, currently-struggling names, is exactly the kind of decision that benefits from a second, informed pair of eyes. That's not a sales pitch for chasing whichever category did best last year, it's the practical case for working with someone who looks at your actual portfolio rather than the headline number.
Inderpreet Singh is a QPFP-certified financial planner and NISM Certified Investment Advisor L1, AMFI-registered MF Distributor (ARN-357884) based in Gurgaon, serving clients across India and NRIs worldwide.
Mutual fund investments are subject to market risks. Past performance is not indicative of future results, and the returns discussed in this article reflect what specific indices have already delivered, not a projection or promise of future performance. Stock-specific commentary in this article reflects publicly available information and general observation of index mechanics, not a recommendation to buy, sell, or hold any specific security. This article is for educational purposes only and does not constitute personalised financial advice.